
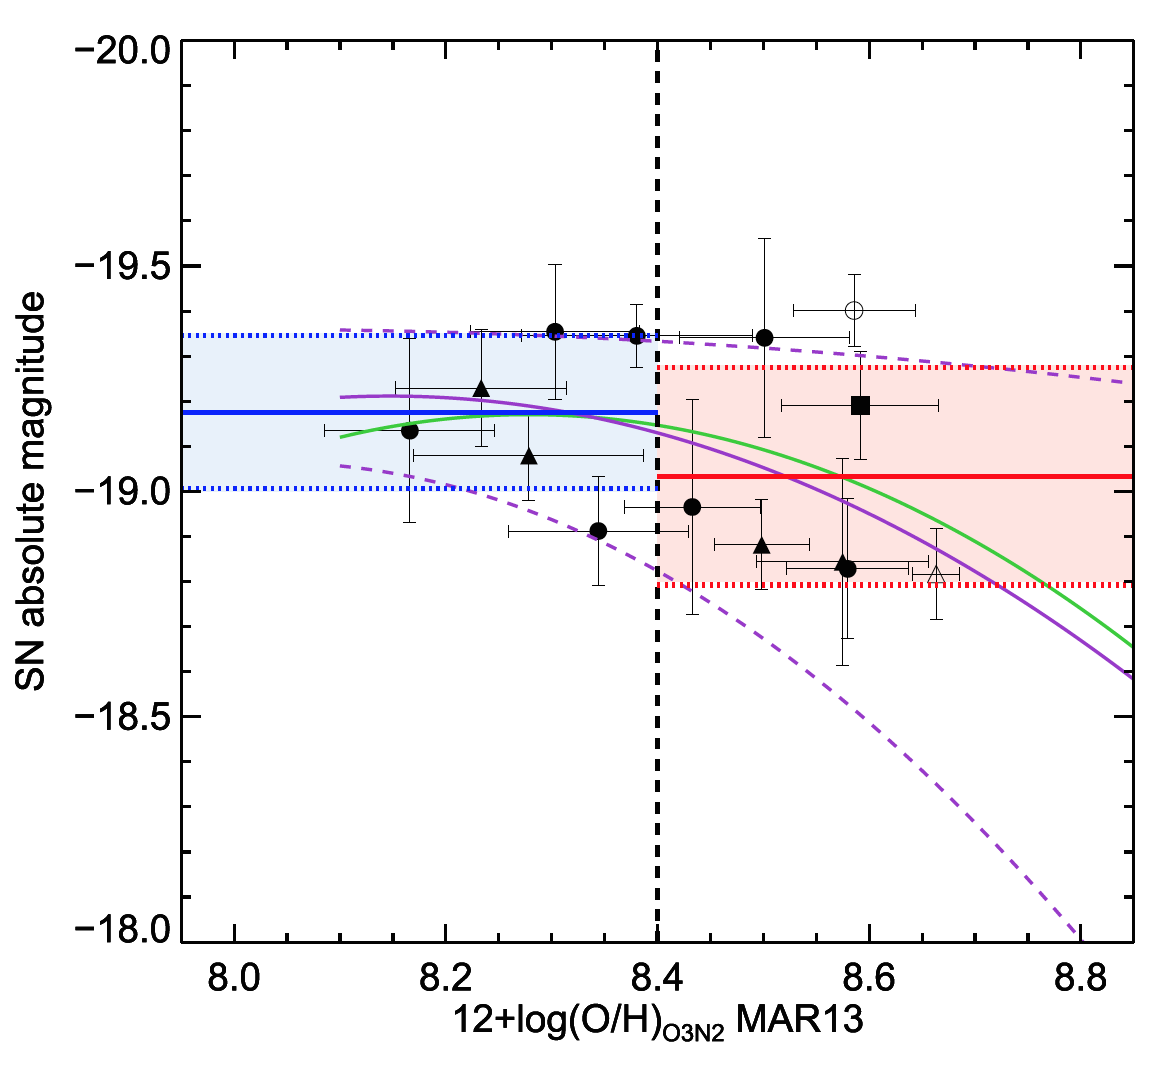
SNeIa absolute magnitudes, MB, as a function of oxygen abundances, OHO3N2. Full and open symbols indicate objects with abundances estimated by
procedures (a) and (b), respectively. Triangles, squares, and circles indicate the method used to derive distances: Tully–Fisher, PNe Luminosity Function, or Tully–
Fisher and Cepheids, respectively. The color indicates the type of SNIa: normal (black), reddened (red), or subluminous (blue). Right: the same plot, but considering
only normal SNeIa. The green solid line is a second-order polynomial fit to the data. The purple solid line is a second-order polynomial fit to four metallicity bins (see
the text). Short-dashed purple lines represent the 1σ uncertainty to this fit. The blue and red horizontal solid lines provide the averaged value in the low- and highmetallicity
regimes, respectively, with their 1σ uncertainty shown with the pale blue and red areas.

SN Ia vs metalicidad
- En
- 30 marzo, 2016
Otros artículos
-
Fechas, cartel y nuevo formato de Naukas Bilbao 2026
- Bilbao 2026, Especial, Eventos
- 2 junio, 2026
-

Ya tenemos programa de charlas y talleres para BCAM NAUKAS «El día de Pi» | Viernes 13 de marzo 2026
- Eventos, Matemáticas
- 18 febrero, 2026
-

Os presentamos Naukas Barcelona 2026 «Ciencia para salvar el mundo» | Sábado 30 mayo en el Museo de la Ciencia CosmoCaixa
- CosmoCaixa, Eventos
- 17 febrero, 2026
-

Oskar González Mendia: "La divulgación me ha ayudado mucho en el camino de la Ciencia al Arte"
- Entrevistas Naukas
- 21 diciembre, 2025
-

Sigue en directo Naukas Palma 2025
- Eventos, Naukas Palma
- 22 noviembre, 2025
-

Ya tenemos programa definitivo de Naukas Palma 2025
- Eventos, Naukas Palma
- 11 noviembre, 2025